
Course Outcomes Organize data for analysis
Course Outcomes
- Organize data for analysis in the form of graphs, tables, and frequency distributions.
- Calculate statistical data for measures of central tendency and dispersion.
- Investigate dispersion through normal distributions using range, mean, standard deviation and z scores,
- Collect, organize, and interpret data to perform regression analysis.
- Measure location, variation, probabilities, distributions, and expectations.
- Formulate a hypothesis, test a hypothesis, and interpret the results.
- Draw conclusions and/or make decisions through the application and analysis of mathematical
models using Microsoft Excel.
Institutional Outcome
- Quantitative and Scientific Reasoning – Follow established methods of inquiry and mathematical reasoning to form conclusions and make decisions.
Directions
You must submit a single Microsoft Word document (Copy your Excel work into Word) and upload your work into the Portfolio Project folder by the due date. You will also submit your Excel document into the Portfolio Project folder showing your work for each problem. You are welcome to use the videos and resources from your Blackboard weekly resource lectures. A list of all the videos is given at the end of this document.
Requirements and Formatting
Your Portfolio Project must be formatted as follows:
- APA formatting
- Title Page
- Times New Roman or Arial 12-point font
- 1-inch margins
- Page numbers in top right corner
Deadline
Deliverable items for the Portfolio Project will be required at different points during the course. Details for each submission are included below in the Deliverable Descriptions.
Deliverable Descriptions
Week 3: Part I
- Due by the end of Week 3 at 11:59 pm, ET.
You are a manager for Company ABC and decide to compile data and analyze your employees’ level of satisifaction. You create a survey to ask each employee to rate their level of satisfaction working at Company ABC.
Table 1 shows data of 15 people employees that responded to your survey. Each of the employees have the same job title: Sales Representative. The data set includes variables regarding an employee ID, gender, ethnicity, region, pay rate, employee satisfaction rating. Each employee was asked to rate their level of satisfaction working at Company ABC. A composite score from 0 (lowest) to 5 (highest) is shown as the data variable employee satisfaction.
Use the data from Table 1 below to answer Questions 1 – 7 below.
Table 1: Employee Data on 15 Sales Representatives at Company ABC
- You send the survey to all 20 employees and 15 responds. Identify the population.
- What level of measurement is the variable: Employee ID?
- Input the data from Table 1 into Excel. Calculate the descriptive statistics on the Pay Rate column (Column D) of the table. (See video links on the last page of this document if needed)
- Paste your Excel descriptive statistics output for the pay rate variable below.
- What is the mean pay rate of the sales representatives?
- What is the standard deviation of pay rate?
- From the data from Table 1, we can look at the Ethnicity variable.
- Use the data from Table 1 to complete the frequency table of ethnicity (Column C) for the 15 participants. You can use the =countif (C2:C21, “White”) function in Excel.
| Ethnicity | Frequency |
| White | |
| African American | |
| Hispanic |
- Using the Ethnicity frequency table (from part A), create a pie chart for Ethnicity of employees. Make sure to include a title and each slice is clearly labeled. Paste your Pie Chart below. (See video links on the last page of this document if needed)
- Using the Ethnicity frequency table (from part A), create a bar graph for Ethnicity of employees. Make sure to include a title your graph and label each axis.
- Do you think the pie chart, or the bar graph displays the differences in the data more clearly for the Ethnicity variable? Explain your reasoning in 2 or 3 sentences.
- Calculate the descriptive statistics for Employee Satisfaction (Column F) to answer the following questions.
- Paste your Excel descriptive statistics output for the employee satisfaction variable below.
- What is the mean employee satisfaction?
- What is the minimum employee satisfaction rating?
- What is the Employee ID of the employee with the lowest satisfaction rating (refer to Table 1)?
- Using the Age variable (Column E), create a histogram using the following frequency distribution.
| Frequency Distribution |
| 30-39 |
| 40-49 |
| 50-59 |
| 60-69 |
- Create a histogram of the Age data for the Sale Representatives. Paste your graph below.
- In 2-3 sentences, describe the shape of the histogram in part A. Would this be considered a symmetric or skewed? If skewed, describe the skewness.
- Continue to focus on Age variable (Column E).
- Calculate the 5-number summary for Age (Column E). Paste the summary below. (See video links on the last page of this document if needed)
- Create a Box plot (Box & Whisker) of Age. Paste your graph below.
Submit your work for Part I in Blackboard by the end of Week 3 at 11:59 PM ET.
Week 5: Part II
- Due by the end of Week 5 at 11:59 pm, ET.
- If you conduct a survey and there is a 75% chance of selecting someone who will complete the survey, what is the probability of selecting someone who will not complete the survey? Make sure to show your calculations for full credit.
Use the data from Table 1 above to answer Questions 9- 14.
- You want to randomly select two employee surveys to review.
- If you randomly select two employee surveys with replacement, what is probability of selecting 2 males? Make sure to show your calculations for full credit.
- If you randomly select two employee surveys without replacement, what is the probability of selecting 2 males? Make sure to show your calculations for full credit.
- What is the probability of randomly selecting an employee survey that is female and hispanic? Make sure to show your calculations for full credit.
- You create a distribution of payrate of our employees. The mean pay rate is 48. The standard deviation is 7.
- What is the z-score for a pay rate of 34? Make sure to show your calculations for full credit.
- In 2-3 sentences, explain what this z score tells us.
- You want to determine which factors are associated with Payrate.
- Create a scatterplot of Payrate and Employee Satisfaction in Excel. Paste your graph below. Make sure your graph has a proper title and axes labels.
- Find the correlation coefficient of Payrate and Employee Satisfaction. Paste your correlation coefficient below. Interpret the direction and strength of the correlation coefficient in 2-3 sentences.
- Create a scatterplot of Payrate and Age in Excel. Paste your graph below. Make sure your graph has a proper title and axes labels.
- Find the correlation coefficient of Payrate and Age. Paste your correlation coefficient below. Interpret the direction and strength of the correlation coefficient in 2-3 sentences.
- Using your answers from part B and part D, is employee satisfaction or age more strongly correlated with Payrate? Explain in 2-3 sentences.
- Complete a regression analysis using Age (x variable) to predict Payrate (y variable).
- Paste your regression analysis output from Excel below.
- Using the output in part a, write out the linear equation to predict payrate based on your data set.
- Use your regression equation in part B to estimate the payrate of a 45-year-old and a 55-year-old employee. Make sure to show your calculations for full credit.
Submit your work for Part II in Blackboard by the end of Week 5 at 11:59 PM ET.
Week 6: Part III
- Due by the end of Week 6 at 11:59 pm, ET.
Use the data from Table 1 above to answer Questions 15 – 17.
- A coworker claims the mean satisfaction rating of ABC employees is 3.2 (on a scale from 1 to 5, where 5 is extremely satisfied). You have reason to believe the mean satisfaction rating of ABC employees, , is different from this value and you plan to conduct a statistical test.
- What is the null hypothesis, H0, that should be used for the test?
- What is the alternative hypothesis, H1, that should be used for the test?
- Is this a one-tailed or two-tailed test? Explain in at least 2 sentences.
- If you decide not to reject the null hypothesis, what type of error might you be making?
- Suppose the true mean satisfaction rating of ABC employees is 3.2. Describe a Type I error in 2-3 sentences.
- To conduct a hypothesis test of the claim that the population mean satisfaction rating of ABC employees is different from 3.2, you choose a random sample of 13 surveys. The sample has a mean satisfaction rating of 3.3 and a standard deviation of 0.6. If the sample is from a normally distributed population with an unknown standard deviation, choose an appropriate test statistic for your hypothesis test on the population mean. Then calculate that statistic. Round your answers to two decimal places. Make sure to show your calculations for full credit.
- The CEO wants to know if the female sales representatives at Company ABC are equally satisfied working at the company as the male representatives. They ask you to determine if there is an average difference in employee satisfaction by gender. Perform a t-test to determine how to answer this question using data from Table 1 above. Use a significance level of 0.05.
- Write out the null and alternative hypothesis for this t-test.
- The data for the Hypothesis Test can be found in Table 2 below. Enter the data into Excel.
Table 2: Employee Satisfaction Scores by Gender
| Female | Male |
| 3.4 | 3.5 |
| 4.8 | 4 |
| 3 | 4.5 |
| 4.1 | 4.6 |
| 4 | 4.1 |
| 4.1 | 3.7 |
| 3.7 | 3.7 |
| 5 |
- Use a significance level of 0.05. Run a 2-Sample Independent t-test using the data from Table 2. Paste the Excel output below.
- Using your output in part C, what are the average employee satisfaction scores for male and female employees at Company ABC?
| Gender | Average Employee Satisfaction |
| Males | |
| Females |
- What is the p-value of the T-test?
- What decision do you make regarding the null hypothesis?
- How would you answer Managements question: Are female sales representatives at Company ABC as equally satisfied working at the company as male representatives? Explain in 2-3 sentences.
Submit your work for Part III in Blackboard by the end of Week 6 at 11:59 PM ET.
Week 7: Final Submission to ePortfolio
- Due by the end of Week 7 at 11:59 pm, ET.
Corrections: This week you will incorporate instructor feedback and make any additional corrections to your Word document before submitting to your ePortfolio. Upload your Portfolio Project to the Institutional Outcome in your ePortfolio listed below. Use the following naming convention: MATH309 – Portfolio Project: NAME
- Quantitative and Scientific Reasoning – Follow established methods of inquiry and mathematical reasoning to form conclusions and make decisions.
For directions on how to upload your project to your ePortfolio, please see Student Resources in Blackboard on the navigation pane.
For specific grading information, please refer to the Portfolio Project Grading Rubric below.
Week 7.5: Reflection
- Due by the end of Week 7.5 at 11:59 pm, ET.
For the final piece of your Portfolio Project, you will reflect upon the course and how it directly relates to your future workplace. This reflection will be delivered as a Word document and should be 250-500 words in length.
- Discuss if your findings confirm or refute your hypothesis.
- Summarize the effect of these findings on your goal statement.
- Describe related answers this data provides to your research question.
- Explain how your findings inform the statement of problem you provide at the beginning.
- Synthesize, analyze, and evaluate your findings in the context of the literature review you performed.
Upload and submit your final reflection to Blackboard. For specific grading information, please refer to the Portfolio Project Reflection Grading Rubric below.
******CLICK ORDER NOW BELOW AND OUR WRITERS WILL WRITE AN ANSWER TO THIS ASSIGNMENT OR ANY OTHER ASSIGNMENT, DISCUSSION, ESSAY, HOMEWORK OR QUESTION YOU MAY HAVE. OUR PAPERS ARE PLAGIARISM FREE.*******."

Communicating Science and Health Information Research Paper
******CLICK ORDER NOW BELOW AND OUR WRITERS WILL WRITE AN ANSWER TO THIS ASSIGNMENT OR ANY OTHER ASSIGNMENT, DISCUSSION, ESSAY, HOMEWORK OR QUESTION YOU MAY HAVE. OUR PAPERS ARE PLAGIARISM FREE.*******."
Wireshark can be used for a deeper
- In this project, you have been given access to a PCAP file from FICBANK to analyze. As you are analyzing this data in Wireshark, note some of the interesting interactions you find within the traffic.
- You can examine some HTTP traffic in the PCAP file you were given for analysis by entering “http” into the Wireshark search bar.

- When you see an image in PCAP traffic, it can be reconstructed with the following steps:
- Right click on one of the packets with the HTTP protocol and select “Follow –> HTTP Stream”.
- Take note of what you see here in the traffic, as it is important to understand what is happening in this interaction.
- Right click on one of the packets with the HTTP protocol and select “Follow –> HTTP Stream”.

- Click “File” on the Wireshark menu and select “Export Objects –> HTTP”.
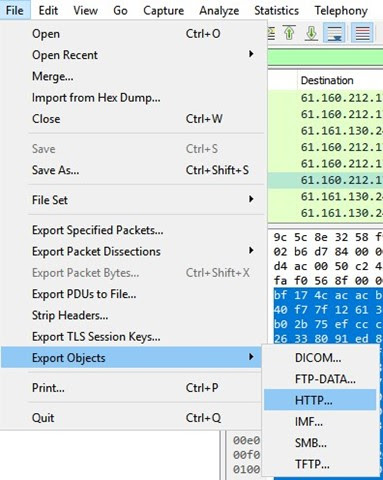
- You should see several images within the popup. Select “preview” on each image to have Wireshark reconstruct and download them. This should open a directory where the images are saved.

-
What is this traffic sample telling you? What information can you piece together from it? Think critically about the pertinent information, and note anything useful for your report.
- Download and install TrID from its source page. This should create a folder called “trid_w32”. Within this folder you should see the trid.exe and triddefs.trd.
- If you don’t see the triddefs.trd file, please go to the TrID webpage and download the latest version. Place it in this folder.
- Thinking back to the Wireshark images we generated, something seems off about them based on their HTTP stream. Let’s make sure they aren’t malicious files.
- Create a new folder in a different directory, as Wireshark saves images in a temporary directory that will be erased on reboot. Move images to this new directory, along with the files from the trid_w32 folder.
- Open the command prompt and run TrID against the images you reconstructed from Wireshark. Take note of some of the different flags you can add to the TrID command line executable.

-
Record what these file types are and save them as part of your evidence gathering process.
- Note the log files you were given access to from the previous lab. What deductions have you made from these logs thus far?
- Now we need to do a deeper analysis using different techniques to continue piecing the story together for our AAR.
- Some popular methods for parsing and searching logs in a native Linux environment are:
- sed
- awk
- grep
- For large scale log analysis, any analyst will quickly learn that these types of native tools are great for searching and manipulating data but fall short on large datasets. It is important to have a fundamental knowledge of them for sorting smaller datasets, but you should take a look at some of the open-source log management tools on the market today.
- Graylog
- Logcheck
- ELK Stack
- Revisit the “access-2” logfile. What can you correlate between the logfile and your Wireshark output? Are there any similarities?
- Try to piece the story together based on the information you see from the provided artifacts.
- Where does it look like the attack originated from?
- What did the attacker attempt to do?
- Compile your findings and incorporate them into your deliverables for this project.
******CLICK ORDER NOW BELOW AND OUR WRITERS WILL WRITE AN ANSWER TO THIS ASSIGNMENT OR ANY OTHER ASSIGNMENT, DISCUSSION, ESSAY, HOMEWORK OR QUESTION YOU MAY HAVE. OUR PAPERS ARE PLAGIARISM FREE.*******."
Using the technological innovation that
Using the technological innovation that you have selected for your final project, consider each of the quantitative and qualitative methods that were addressed in the textbook reading for choosing innovation projects. For each method, briefly discuss the applicability of that method for the business scenario provided for the final project. Recommend a specific method or combination of methods to use for the business scenario. Should you apply the recommendation, would the method recommend the same innovation that you chose in your Final Project Milestone One? Why or why not?
Textbook: Strategic Management of Technological Innovation, Chapters 6 and 7
These two chapters identify techniques used to develop an organization’s strategy for technological innovation as well as objective methods for evaluating potential innovations relative to the developed strategy.
******CLICK ORDER NOW BELOW AND OUR WRITERS WILL WRITE AN ANSWER TO THIS ASSIGNMENT OR ANY OTHER ASSIGNMENT, DISCUSSION, ESSAY, HOMEWORK OR QUESTION YOU MAY HAVE. OUR PAPERS ARE PLAGIARISM FREE.*******."
In this assessment, you will create a final
-
In this assessment, you will create a final business report that you will write in your role as a business consultant. This report will be compiled from your previous assessments with the addition of new material. In this report, you will inform the CEO of CapraTek of potential business problems and effective organizational leadership models, theories, and frameworks that put the problems into perspective.
- Write a one-page executive summary that summarizes the 8–10-page business report.
- Describe best practices for the creation of a business plan that aligns with organizational goals, with the inclusion of a business planning model and an illustration of that model.
- Make any revisions to the three potential business problem statements you developed in the previous assessments, stating the problem for each of the following three areas: leadership, information systems, and marketing. You can use phrasing such as, “The potential leadership problem is…”
- For the leadership problem, include an illustration that shows how the problem was narrowed down using a fishbone diagram (Ishikawa diagram) or a cause-and-effect diagram, where you identified the problem, worked out the major factors involved, and identified possible causes of the leadership problem.
- For your leadership problem, identify a framework (which can be based on a theoretical or conceptual framework) and explain how the framework relates to the leadership problem. Explain the rationale for selecting this framework.
- For your leadership problem, construct and include a mind map to illustrate the linkages among the key concepts in the framework. Give a detailed explanation of the mind map
- For each problem you developed, identify, discuss, and explain a theoretical model or theory within scholarly and practitioner literature that can be used to further understand the problem. For clarity, you should identify, discuss, and explain at least three theoretical models or theories, not simply one theoretical model or theory that would apply to all three business problems. Your objective is to help the CEO of CapraTek identify and understand that these problems exist in the larger industry, and that CapraTek might also experience these same problems. Your goal is not to try to solve the problem.
- In addition, create an appendix with a brief (1-2 paragraphs) reflection on the writing feedback you received and how you applied the feedback to improve your work. Reflect on the nature of the constructive feedback you received, and explain how you will improve the quality of the doctoral work.
-
- Executive Summary.
- Best Practices for the Creation of a Business Plan and a Business Model Illustration.
- Potential Leadership Business Problem.
- Theory or Theoretical Model.
- Fishbone Diagram and Explanation.
- Framework and Rationale.
- Mind Map and Explanation.
- Potential Information Systems Business Problem.
-
-
- Theory or Theoretical Model.
- Potential Marketing Business Problem.
-
- Theory or Theoretical Model.
- Summary.
-
Appendix: Reflection on Feedback.
******CLICK ORDER NOW BELOW AND OUR WRITERS WILL WRITE AN ANSWER TO THIS ASSIGNMENT OR ANY OTHER ASSIGNMENT, DISCUSSION, ESSAY, HOMEWORK OR QUESTION YOU MAY HAVE. OUR PAPERS ARE PLAGIARISM FREE.*******."
Write a 4–5-page business report
- Develop a potential business problem for each of the following three areas: leadership, information systems, and marketing management, for a total of three business problems. A good way to start each problem statement is, The potential business problem is…..
Describe how each business problem relates to concerns that businesspeople in the larger industry, field, or area care about.Support your problem statements by presenting evidence from scholarly literature. In other words, state your potential business problems that leaders may experience, and then follow with cited facts to support your claims regarding the problems.For your leadership problem, include an illustration that shows how the issue was narrowed down using a fishbone diagram or a cause-and-effect diagram, where you identified the problem, worked out the major factors involved, and identified possible causes of the leadership problem. You can search the Internet using the search term “fishbone diagram template” to find a variety of free templates to use. You might need to take a screenshot of the completed diagram using your computer’s snipping tool, copy the screenshot, and then paste it into your paper.
- Executive Summary.
Potential Leadership Business Problem and Fishbone Diagram.Potential Information Systems Business Problem.Potential Marketing Business Problem.Summary
******CLICK ORDER NOW BELOW AND OUR WRITERS WILL WRITE AN ANSWER TO THIS ASSIGNMENT OR ANY OTHER ASSIGNMENT, DISCUSSION, ESSAY, HOMEWORK OR QUESTION YOU MAY HAVE. OUR PAPERS ARE PLAGIARISM FREE.*******."
GrowCo Engineering Incentive
GrowCo Engineering Incentive Plan – C
Performance in the design engineering department of a major manufacturer had been less than satisfactory in terms of adherence to schedule, drawing quality, and the number of “mission-critical” complaints received from operations personnel. In an attempt to address these problems, on December 1, 2022, GrowCo approved a 2023 short-term incentive compensation plan for its engineers. The plan provides the potential for an annual bonus based on individual performance. Engineers are to be evaluated annually on three major factors. Individual factors include (1) adherence to schedule deadlines and (2) drawing quality (opposite of error rate). They will also receive a “group rating” based on the number of major complaints received by the department from operations personnel. 30% of the bonus will be determined by performance to schedule; 50% will be determined by drawing quality; and the remaining 20% will be determined by the number of mission-critical complaints received by the department. The following table summarizes the criteria to be used in determining the bonus amounts:
| Performance
Criteria |
Criterion
Weight |
Threshold
Performance Rating |
Target
Performance Rating |
Maximum
Performance Rating |
| Adherence to Schedule | 30% | 70% | 80% | 100% |
| Drawing Quality | 50% | 90% | 95% | 100% |
| Number of Mission Critical Complaints Received by Dept. |
20% |
5 |
2 |
0 |
Note: Threshold performance is the minimum level of performance qualifying for an incentive award; target performance is the level of performance qualifying for the full incentive award; maximum performance rewards performance above target with an additional incremental incentive payout.
For each criterion, at threshold performance, the individual payout is 50% of target bonus; there is no payout for performance below threshold. At target performance, the individual payout is 100% of target bonus. At maximum performance, the individual payout is 150% of target bonus. Individual payout is adjusted proportionately for performance between these values; that is, payout values are interpolated when they fall between set values. For 2023, the individual bonus target was set at 20% of salary.
- What would an engineer’s incentive payout be for 2023 if the engineer’s salary is $100,000 and he/she attains target performance for adherence to schedule, a drawing quality rating of 97.5%, and the department receives a total of 3 mission-critical complaints during 2023? Interpolate as necessary. Show all work!
- What is your evaluation of GrowCo’s incentive plan? That is, what do you like about its design? What do you not like? What would you change if you could? Is it consistent with the principles of individual incentive plans? Explain the reasoning involved in your evaluation.
NOTE: Interpolation is the computation of points or values between points that are known based on their relationship to other known points. For example, if performance is ¼ of the distance between the performance threshold and the performance target, then one might estimate that an incentive payout would be ¼ of the distance between the threshold payout value and the target payout value. See PPT included in this week’s module for additional explanation.
******CLICK ORDER NOW BELOW AND OUR WRITERS WILL WRITE AN ANSWER TO THIS ASSIGNMENT OR ANY OTHER ASSIGNMENT, DISCUSSION, ESSAY, HOMEWORK OR QUESTION YOU MAY HAVE. OUR PAPERS ARE PLAGIARISM FREE.*******."
Locate the latest proxy statement
Locate the latest proxy statement for any of the three companies listed below (see “Notes” for guidance in locating the proxy statement):
- Lockheed Martin 2. Kraft Heinz 3. Visa
For the company you select, you will analyze the company’s executive compensation program. Specific factors to be considered are presented below. Refer to materials in the Week 7 module reading “Executive Compensation Disclosure Handbook” for clarification of compensation terms and to SEC Regulation S-K, Item 402 – Executive Compensation, for disclosure requirements. Address the following questions:
- What are the objectives of the company’s executive compensation program? Do they appear to support the company’s business strategy? If so, how? Demonstrate the linkage.
- On what factors is the CEO assessed? Based on what you have learned about performance appraisal in this course, are the factors/measures used to assess CEO performance appropriate? Are the factors used to assess the performance of the CEO adequately described?
- What was the CEO’s total compensation ($) for the most recent year? Does this level of compensation appear to be warranted? Why or why not? Support your response with appropriate arguments, references, or comparisons.
- What is the targeted mix of compensation (expressed as a % of salary, % of annual incentive, and % of long-term incentive) for the CEO? Is this a “good” mix of measures? Why or why not?
- What percentage of the CEO’s total compensation is “at risk” (i.e., performance-based)? Does the amount of pay at risk change your view of whether executive pay is too high? Why or why not?
- What percentage of the CEO’s total compensation is equity-based (long-term incentive paid in stock)? Why do companies use equity-based compensation?
- Many professionals rely on comparisons of executive compensation with Total Shareholder Return (TSR) as an indicator of “fairness” in executive pay. Does the company you selected use TSR? What is your opinion of TSR as a measure for assessing how well the CEO is performing? What alternatives are proposed by other professionals? Support your response with appropriate references. Does the company you selected use TSR? If so, how?
- In 2018, the SEC implemented a provision of the Dodd-Frank Act that requires U.S. public companies to disclose the ratio of the CEO’s total compensation to that of the “median employee.” Why was this provision enacted? Do you believe that this “Pay Ratio Disclosure Rule” will be beneficial in controlling executive compensation? Why or why not? Support your response with appropriate arguments and references. What is the CEO pay ratio for the company you selected?
- The Dodd-Frank Act also requires periodic “Say on Pay” shareholder votes. What precisely does this provision of Dodd-Frank require? What were the results of your company’s more recent vote? Do you believe this rule will be beneficial in controlling executive compensation? Why or why not?
- What is your personal take-away from this assignment? In other words, what did you learn about executive compensation that you did not know prior to this assignment? What benefited you the most from the assignment? Be specific!
Your proxy analysis should be prepared as a formal student paper following APA guidelines (7th ed.). Respond to the questions posed above within an essay format; do not simply list and answer the questions. The analysis must have a title page followed by an abstract and text with major section headings addressing each of the issues identified by the questions above. For example, the first section heading after the Abstract might be titled “Executive Compensation Philosophy.” This heading should be followed by a narrative discussion and evaluation of the “executive compensation objectives” or the “compensation philosophy of the company.” Be sure to address the questions posed above in your narrative response in each section. The paper should be double-spaced using a 12 pt font and limited to a maximum of 10 pages, excluding the title page and references. So be succinct. One page per major topic area should be adequate to ensure adequate coverage. Back up your statements with arguments, citations, and references.
Notes:
- SEC Regulation S-K, Item 402 is summarized in a website sponsored by the School of Law, Cornell University (law.cornell.edu/cfr/text/17/
229.402Links to an external site.). - A Proxy Statement can frequently be located on the company’s corporate website. It can also be located at www.sec.govLinks to an external site.. Enter the EDGAR database, enter the name of the company and locate the latest version of Form DEF 14A. This will be the Proxy Statement. Be sure that you have the most recent filing.
3. This is an individual assignment; collaboration with others is not permitted
******CLICK ORDER NOW BELOW AND OUR WRITERS WILL WRITE AN ANSWER TO THIS ASSIGNMENT OR ANY OTHER ASSIGNMENT, DISCUSSION, ESSAY, HOMEWORK OR QUESTION YOU MAY HAVE. OUR PAPERS ARE PLAGIARISM FREE.*******."
For the week 6 assignment
For the week 6 assignment, you will write a 1–2-page (not including title and reference page) summary of your study approach and literature review updates. Follow the prompts below to complete the assignment.
Choose – Choose a study approach for your research proposal. Utilize the information from your literature review, Chapter 7 of the textbook, and the week 6 Lecture to help inform your choice.
Review – Complete a thorough review of the articles you have researched throughout the past weeks. Compare the articles to your current literature review completed in week 3. Determine if any additional information should be added to your literature review. Your final literature review should offer support for the problem or need you have identified in your research study proposal.
Write – Write a 1- to 2-page (not including title and reference page) paper. Include the following elements in your paper:
- Overview of the chosen research study approach.
- Identify if you chose a quantitative, or qualitative, type of study and which approach you intend to use.
- Rationale for choosing the study approach.
- Overview of any changes, additions, or deletions you made to your literature review and the reason for the changes.
******CLICK ORDER NOW BELOW AND OUR WRITERS WILL WRITE AN ANSWER TO THIS ASSIGNMENT OR ANY OTHER ASSIGNMENT, DISCUSSION, ESSAY, HOMEWORK OR QUESTION YOU MAY HAVE. OUR PAPERS ARE PLAGIARISM FREE.*******."
Instruction for Journal Club Presentation
Instruction for Journal Club Presentation/Discussion
We will discuss the assigned research articles and relevant articles. All students are expected to read and be familiar with the entire article. This part of the class is graded, and attendance is mandatory. Please talk to Dr. Chin ahead of time if you must miss a class. In such case, you are expected to submit a special assignment on the research articles.
Each presenting group will have a total time of ca. 40 min and should allocate ca. 10 min (out of total time) to present the introduction/background. Please prepare about 30 slides for the entire presentation. The introduction presented must be based on assigned research article (main article & supplementary information published with the main article) and extra readings (some of the prior relevant papers and the newer studies that were published since then) and you should not simply rephrasing it from the assigned articles. After each presentation ca. 15 min. will be used for the questions & discussion. During this section the instructor may ask the presenter and all class students some questions.
See the specific instructions for the presentation below. Your grade for this assignment will be based on the quality and clarity of the presentation, knowledge of the specific research field and material, ability to answer questions, and participation in the overall discussion (not only during your presentation).
Specific Instructions:
Each presenting student must prepare a Power Point file with the slides containing the following sections:
- Introduction with illustration; 2) Specific methods; 3) Results (figures/tables in the main article with brief description & supplementary information published with the article) & Explanation; 4) Summary/Take home message; 5) Questions for discussion.
If a certain figure is too large, you may split it over separate slides.
A complete presentation PowerPoint file must be emailed to me by 5 PM the day before the presentation.
*NOTE: Each presenting group is expected to answer questions on all parts of the experiments described in the assigned article. You should be prepared to present and answer questions regarding the followings:
- The underlining hypothesis(s) for each set of
- The question each experiment is
- The methodology used for each experiment (the principles of the method should be presented and not the technical details such as buffer composition, concentrations, etc.). You may include additional figures to explain the method, if relevant.
- The purpose and nature of the controls (for each experiment). You should be able to explain the variables that the controls are controlling for the main observations and conclusions.
- If relevant, include the supplementary information associated with set of
Journal Club Summary Instruction
For each Journal Club each student is required to read and write a summary of the research article and questions for discussion we will be discussing that day. These summaries and questions must be typed and emailed to me
Summaries should be 1-2 pages with double space and 12 pt fonts (Times Roman or Arial). Your summary must include the answers for the following questions:
- What is the aim(s) of the author’s study?
- List and describe at least three (3) interesting research findings you learned from the research
- List what kind of experimental methods were employed for the author’s study and briefly describe each method.
- What are the overall significance and implications of the research article?
******CLICK ORDER NOW BELOW AND OUR WRITERS WILL WRITE AN ANSWER TO THIS ASSIGNMENT OR ANY OTHER ASSIGNMENT, DISCUSSION, ESSAY, HOMEWORK OR QUESTION YOU MAY HAVE. OUR PAPERS ARE PLAGIARISM FREE.*******."